How to compare your VS Code extension's growth with competitors
Compare VS Code extension installs fairly: pick real peers, match dates, use window gains and percentages, handle decreases and gaps, and keep registries apart.

Builds VSXRank · 7 min read

The install count on a Marketplace listing is an accumulated public statistic. A larger total does not by itself tell you which extension is growing faster now. To compare your VS Code extension with competitors, pick peers that compete for the same user, read every counter at the same moment, and measure the gain over a whole number of weeks. Then look at absolute gain and percentage of the starting count together, and keep each registry's counter in its own column.
How to compare VS Code extension installs fairly#
Here is the method in short. Each step is explained below with measured data.
- Pick comparable peers. They should do the same job, appear for the same searches and be within roughly ten times of each other in size.
- Match the dates. Every extension is read at the same timestamp, and every window starts and ends on the same reading.
- Use window gains, not daily deltas. Seven or fourteen days covers each weekday the same number of times.
- Report absolute gain and percentage of base together. Each one on its own favours a different kind of extension.
- Decide in advance how to handle decreases, gaps and imported history, and write that down next to the numbers.
- Never mix registries. Marketplace installs and Open VSX downloads go in separate columns.
Choose peers that compete for the same user#
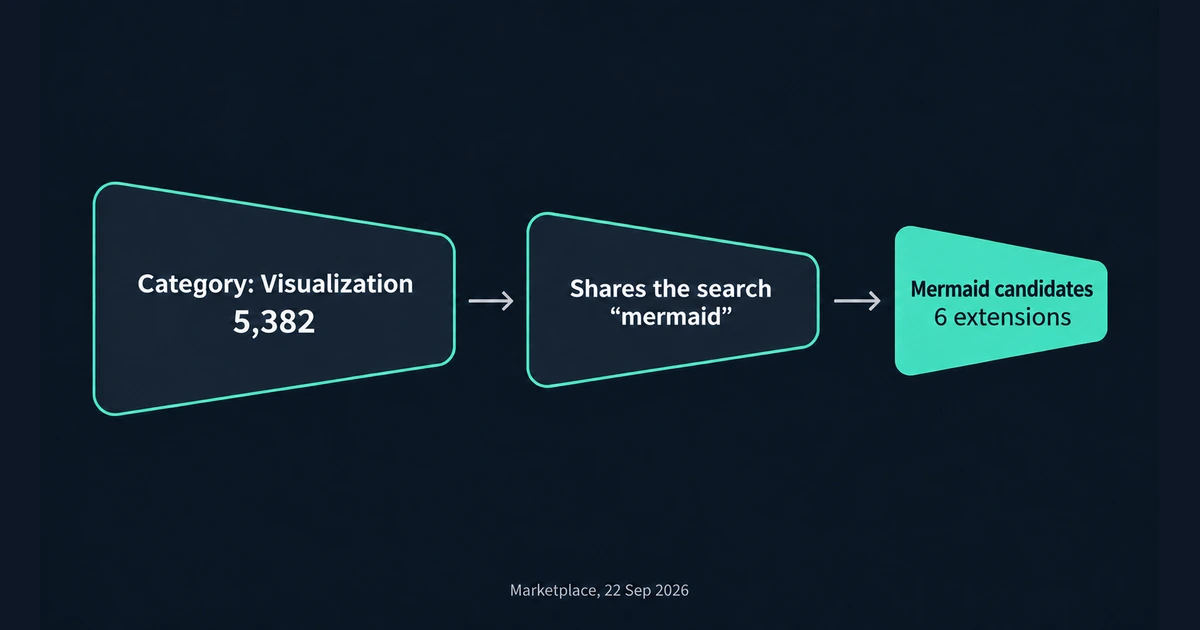
Publishers choose their own categories in the extension manifest, from a fixed list (Extension Manifest). So a category is a broad bucket, not a set of rivals. On 22 September 2026, the Marketplace Visualization category held 5,382 listed extensions. The top of that category includes Jupyter, WakaTime, a PHP profiler and a PDF viewer. None of them competes with the others.
A better filter is shared search results. We took the Marketplace results for mermaid and kept the Visualization extensions that appeared in the first 12 positions. That left six extensions, all built for Mermaid diagrams. Markdown Preview Mermaid Support ranked #2 for the same search but lists itself under Other, so we kept it only as a reference row. Its 5.3 million installs also put it in a different size class.
A worked comparison: Mermaid extensions on the Marketplace#
All figures below are Marketplace install counters in the daily series labeled 00:00 UTC. The 7-day window runs from 15 to 22 September 2026 and the 14-day window from 8 to 22 September. Every value in these comparison windows comes from our first-party collection. The 8 September starting values were interpolated to midnight from actual read times; the 14-day comparison includes that adjustment.
| Extension | Installs, 22 Sep | 7-day gain | 7-day % | 14-day gain | 14-day % | mermaid rank, 22 Sep |
|---|---|---|---|---|---|---|
| Mermaid | 1,086,300 | +15,461 | 1.44% | +29,538 | 2.80% | #1 |
| Mermaid Preview | 858,826 | +13,775 | 1.63% | +27,731 | 3.34% | #3 |
| Draw.io Integration: Mermaid plugin | 126,916 | +602 | 0.48% | +1,284 | 1.02% | #7 |
| Mermaid Graphical Editor | 78,066 | +373 | 0.48% | +870 | 1.13% | #8 |
| Mermaid MMD Tools | 22,739 | +520 | 2.34% | +951 | 4.36% | #10 |
| Mermaid Viewer | 6,545 | +275 | 4.39% | +536 | 8.92% | #12 |
| Reference: Markdown Preview Mermaid Support | 5,311,711 | +27,608 | 0.52% | +54,763 | 1.04% | #2 |
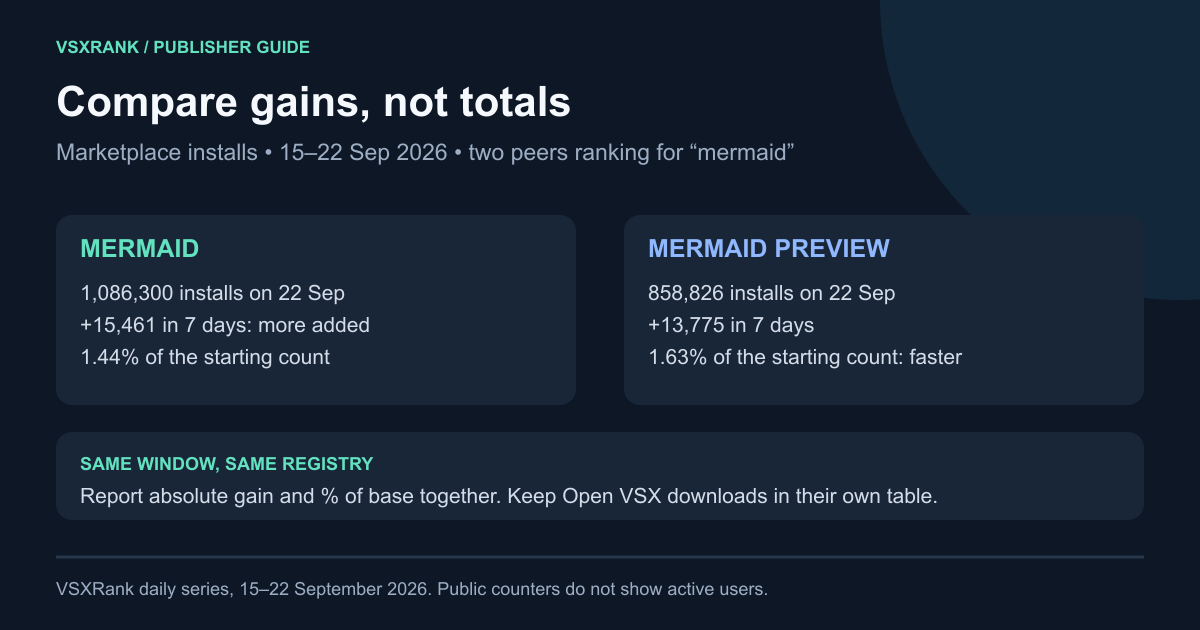
The two largest extensions are the closest match, at 1.09 million and 0.86 million installs. From 8 to 15 September they grew almost equally: +14,077 for Mermaid and +13,956 for Mermaid Preview. From 15 to 22 September, Mermaid added 1,686 more, and the gap between them grew from 225,788 to 227,474. Over the same week, Mermaid Preview grew faster as a percentage (1.63% against 1.44%). Both statements are true. Which one matters depends on your question.
Absolute gain or percentage of base#
Absolute gain answers "who added more installs?" and favours large extensions. Percentage of base answers "who grew faster relative to where they started?" and favours small ones. In the table, Mermaid MMD Tools added fewer installs than the Draw.io plugin (+520 against +602) from a base under one fifth the size. As a percentage, that is nearly five times the growth.
The small-base effect gets extreme across a whole category. When we sorted Visualization by 7-day percentage, counting only extensions that started the week with at least 1,000 installs, every one of the top eight had under 30,000 installs. The leader went from 21,830 to 26,643, a 22% gain. So only compare percentages within a size band. And never rank by percentage without a minimum base.
Rank by total versus rank by recent gain#
In the same category and week, WakaTime ranked #3 by total installs but #29 by 7-day gain, with +2,621. Mermaid ranked #17 by total and #9 by gain. Mermaid Preview ranked #20 by total and #10 by gain. A leaderboard sorted by total reflects accumulated activity and listing age together. A leaderboard sorted by recent gain shows where installs are going this week.
Match dates and use whole weeks#
Each row in the VSXRank daily series is labeled 00:00 UTC; the crawl reads extensions over time, so that label is not a simultaneous measurement. Compare two extensions using the same daily window and check their actual read times when timing matters. A number copied from a listing at lunchtime cannot be compared with one read at midnight.
Weekly patterns are big enough to change a result. Mermaid gained 3,890 installs on Wednesday 16 September and 616 on Saturday 19 September. A window that covers two weekends for one extension and one weekend for another is not a fair comparison. Use 7 or 14 days, ending on the same reading. One more note: our readings for 5–10 September were adjusted to 00:00 UTC from the actual read times, so the 8 September starting values above are adjusted values, not raw readings.
Handle counters that go down#
The Marketplace figure can decrease, but a decrease is not a measured number of uninstalls. A community answer in discussion #617 recalls an active-install definition without a supporting specification; it conflicts with an earlier Marketplace-team explanation. Our install-counter guide separates those sources from what the data shows. We have measured the public counter moving down within minutes. On 5 September 2026, two full catalog readings 13 minutes apart showed 6,660 of 103,263 extensions with a lower count the second time.
From one midnight to the next, decreases are rare. From 5 to 22 September, 302 of about 1.96 million daily pairs on the Marketplace went down. Three hundred of them fell on a single day pair, 19→20 September, and added up to −493 installs. The largest single drop was −14. Every decrease belonged to an extension with fewer than 10,000 installs. Here is how to handle them:
- Measure the change over the whole window. Don't add up only the positive days.
- Don't round a negative value up to zero. Mark it and keep it in the data.
- Treat a one-day drop as a data-quality question, not a trend, until it happens again.
Missing readings and imported history#
A missing reading is not zero growth. Across those same Marketplace pairs, 8,548 had a gap longer than one day. Nearly all of them (8,539) belonged to extensions with fewer than 1,000 installs. When the interval is longer, divide the gain by the actual number of days, or leave that extension out of the window. Don't plot the next reading as a one-day spike.
VSXRank's history before 5 September 2026 comes from third-party trackers. It covers only part of the catalog: about 20,000 extensions on 21 August and about 3,500 in early August. We label that history wherever it appears. Check coverage for every peer and window; no duration guarantees complete readings for every extension. A first-party comparison across mixed peers should start on or after 5 September. If only one side has imported history, the comparison is uneven.
Keep Marketplace installs and Open VSX downloads apart#
Open VSX publishes a download count, and that count rises every time a version is downloaded, including updates. Why Open VSX downloads look inflated covers the definition. The Mermaid set shows why the difference matters. Mermaid Viewer had 6,545 Marketplace installs but 132,798 Open VSX downloads on 22 September. In the same week it gained +275 installs and +26,278 downloads. Its Marketplace listing also showed four version changes between 13 and 20 September. Mermaid had 1,086,300 installs and 1,746,809 downloads. Adding either pair of numbers together, or ranking them in one list, would be meaningless. Build one table per registry.
What public counters cannot tell you#
Public counters show changes in listings. They do not describe your audience. They cannot tell you how many people actively use an extension, how many new installs and how many uninstalls make up a net change, where users came from, or how many people viewed the listing. For your own extension, the Marketplace publisher management page shows acquisition trend, total acquisitions and ratings. Nobody can see those reports for a competitor.
Search position is a separate signal. It is useful for choosing peers, but small moves are mostly sampling noise below the top 10 (measuring Marketplace jitter). When a competitor's gain picks up, check its releases and listing edits over the same dates. Record what changed and when. That shows what changed at the same time, not why the gain changed.
To follow this comparison without building it yourself, track competitors without an ownership check and pin them next to your extension. Or open the live demo to see matched-date gains, separate registry views and competitor charts on a real extension.