What does the VS Code Marketplace install count actually mean?
What the VS Code Marketplace install count includes, why updates are excluded, why it can fall, and what 1.9 million daily readings show about decreases.

Builds VSXRank · 7 min read

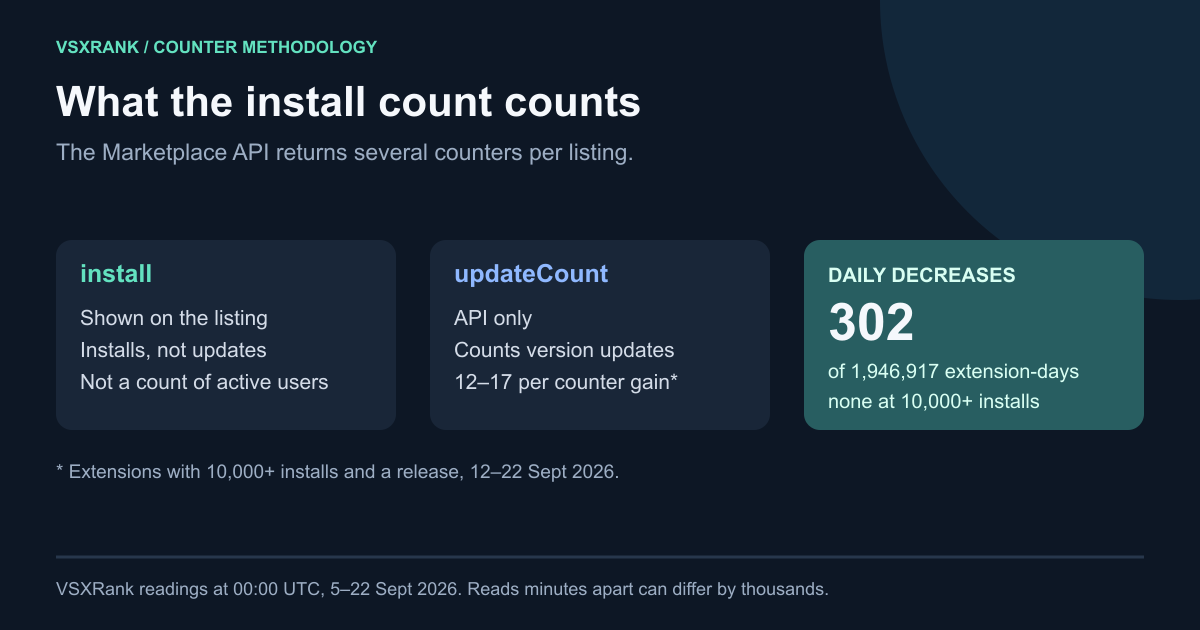
The number under a VS Code Marketplace listing is the gallery's install statistic. Since 2019 it has excluded updates, which are counted separately in updateCount. It is not an active-user figure, it does not tell you about uninstalls, and it sometimes goes down. In 1,946,917 midnight-to-midnight readings from 5 to 22 September 2026, it fell on 302 extension-days. Those drops were small; all 300 in the 20 September cluster recovered by the next reading. Within a single hour, it wobbles much more.
What the VS Code Marketplace install count includes#
Each Marketplace listing carries a statistics array in the gallery API. VS Code reads one entry from it: the Extensions view shows installCount from the statistic named install (extensionGalleryService.ts). VSXRank stores the rest of the array too:
| Statistic | What it tracks | Where it shows |
|---|---|---|
install | Installs, not updates (Microsoft, 2019) | Listing, VS Code, sort by installs |
updateCount | Updates to a new version | API only |
downloadCount | Probably direct VSIX downloads from the website (undocumented) | API only |
averagerating, ratingcount | Star rating and number of ratings | Listing |
trendingdaily / weekly / monthly | Marketplace trending scores | API only |
The main change is recorded in microsoft/vscode#80551 (September 2019). The Marketplace team said it would drop the "downloads" figure, which was install + updateCount, and show "installs" on detail pages, tiles and publisher lists. Sorting by installs would use only the install statistic, and VS Code changed to match. So a release that updates a million copies does not add a million to the public number.
The client code matches this. When VS Code downloads a package, it adds install=true or update=true to the request (source), so the Marketplace can count the two separately. In 2022, a Marketplace engineer said that installs from VS Code include web versions of VS Code, and that an extension pack install also counts for the extensions it contains.
Uninstalls: the sources disagree#
In the same 2019 thread, a Marketplace engineer said the install count is not reduced when someone uninstalls, and that there were no plans to change that. A 2023 community answer said the page had switched to "active installs". We found no Microsoft documentation of that. Desktop VS Code does send an uninstall statistic (source). That feeds the publisher's Uninstalls report, which Microsoft announced in 2017 alongside the Acquisition report.
Our data fits the 2019 statement. If uninstalls came off the total, extensions with no new installs would fall on quiet days. Across 1.9 million daily readings, they almost never did. That is our reading of the data. Microsoft has not documented it.
The public counter is not your Acquisition report#
The publisher hub splits acquisition into "Install from VS Code", "Download from Marketplace" and page views, and its totals rarely match the public figure. Publishers have raised this since 2021 (#4, #1363), and there is still no published definition. Use the report for your own funnel and the public counter for comparing listings. Don't try to make them add up.
Why the install count can go down#
Publishers have reported the counter going both up and down when they refresh a page (#973, 2024). One tracker logged hourly ms-python.python values that fell by thousands and then rose again (#1218, 2025). Microsoft logged it as a bug in March 2026. We saw the same thing on 5 September 2026. Two full catalog reads 13 minutes apart showed 6,660 of 103,263 extensions lower on the second read, and ms-python.python down 10,899. That pattern is consistent with variability in the served total; it does not establish that people left.
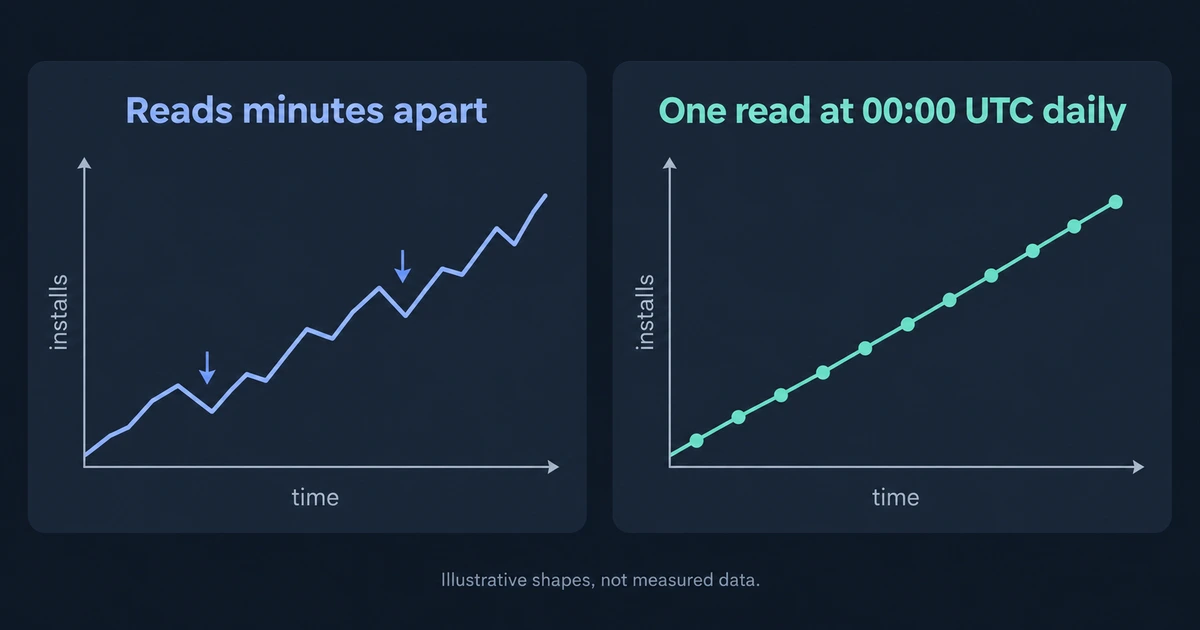
The daily series looks very different from those short-interval checks. We examined every Marketplace extension's daily value, labeled 00:00 UTC, from 5 to 22 September. Those labels group readings by day; they do not mean every extension was fetched at the same instant:
| Installs on first reading | Extensions | With ≥1 daily decrease | Day pairs unchanged |
|---|---|---|---|
| Under 100 | 49,157 | 15 (0.03%) | 92.0% |
| 100–999 | 37,721 | 70 (0.19%) | 80.2% |
| 1,000–9,999 | 20,557 | 217 (1.06%) | 55.0% |
| 10,000–99,999 | 6,987 | 0 | 13.6% |
| 100,000–999,999 | 1,816 | 0 | 0.6% |
| 1,000,000+ | 536 | 0 | 0.0% |
| All | 116,774 | 302 (0.26%) | 74.8% |
VSXRank first-party readings, 5–22 Sept 2026, 1,946,917 consecutive-day pairs. Readings for 5–10 Sept were interpolated to midnight from the actual read times.
- Almost all on one day. 300 of the 302 decreases came from the 20 September reading. The other two were on interpolated 5–6 September rows. Every other day pair had none.
- Small. 211 were −1, 78 were −2 to −4, and the largest was −14. The total across all 300 was −493 installs. The median drop was 0.09% of the extension's total. The largest percentage drop was a listing with very few installs going from 8 to 5.
- Clustered in one size band. 217 of the 300 were in a narrow band of 2,129 to 2,366 installs. No extension at 10,000 or more fell on any day. The largest single drop was
DevChauhan.reicon, from 2,180 to 2,166. - Recovered. All 300 were back at or above their 19 September value by the 21 September reading, and 194 were already higher.
The same 20 September reading had the only decreases in updateCount (60) and downloadCount (52) in the period. Many drops fell in one narrow slice of the catalog, and all of them recovered the next day. That looks like a stale response for part of the catalog, not uninstalls. The third-party history we imported for 3,875 extensions (11 June to 4 September) has no daily decreases in 284,649 pairs. That history comes from another tracker's readings, and we can't check how they were cleaned.
Updates are counted separately#
The strongest pattern in the other stored statistics is between releases and updateCount. We looked at 10 days (12–22 September) for extensions with at least 10,000 installs that gained installs. We then grouped them by how many distinct versions appeared in their daily readings:
| Versions seen in 10 days | Extensions | Median updateCount gain per new install |
|---|---|---|
| 1 (no release) | 8,971 | 0.006 |
| 2 | 196 | 12.2 |
| 3–4 | 69 | 13.6 |
| 5 or more | 51 | 16.8 |
Some examples from the same window: anthropic.claude-code showed seven versions, gained 670,848 installs and 25,843,750 updates. eamodio.gitlens showed six versions, gained 196,032 installs and 3,699,710 updates. ms-python.python showed two versions and gained 1,394,018 installs and 973,774 updates. Frequent releases increase update volume, and the public install figure leaves updates out. This is why Open VSX totals can't be compared directly. Open VSX counts every package download, updates included, as explained in why the Open VSX download count looks inflated.
Two smaller findings. For extensions with no release, downloadCount grew by about 0.03 per new install. That fits the idea that it counts website VSIX downloads, but it is not proof. ratingcount increased 309 times and never decreased.
What the install count cannot tell you#
- Active users. Updates are excluded and uninstalls probably are not subtracted. A total built up over years says little about who uses the extension today.
- People. One developer who installs on a laptop, a desktop and in Codespaces can count more than once.
- Why it changed. A jump after a listing edit or a release shows timing only. It doesn't tell you what drove the change.
- Single days, at small sizes. A listing with a few hundred installs is unchanged on 80% of days, so a quiet week is normal.
How to read it responsibly#
- Compare gains, not totals. A total combines accumulated activity with listing age. Compare how much listings gained over the same dates.
- Use a fixed reading time. Hour-to-hour values can move by thousands for large listings. Read at the same minute each day, and use a 7-day window as the minimum.
- Preserve decreases without labeling them lost users. Keep the raw observation and annotate an unusual drop. If you also show a smoothed trend, label the transformation and retain the original values; silently carrying the last value forward would hide evidence.
- Mark releases. Updates don't count toward installs, so a release that looks quiet on the counter may still have reached many existing users. Check
updateCountto see that. - Keep registries in separate columns. Marketplace installs and Open VSX downloads are different measures. Don't add them together.
- Use your own Acquisition and Uninstalls reports for questions about your funnel. The public counter can't answer them.
VSXRank schedules its nightly Marketplace crawl for 00:01 UTC and records the full statistics array as listings are fetched. The daily date label is not a simultaneous read of every listing. It never shows a raw negative day as a loss. See it on a live extension in the demo, where install gains, releases and search positions sit on one dated timeline.